GENIUS AI
Application Insight, Infrastructure Monitoring & Performance Analytics Application Intelligence Platform (AIP) for creating application health and user experience monitors.
GENIUS AI – Augmented Intelligence

Application Insight, Infrastructure Monitoring & Performance Analytics
GENIUS AI is a service platform for aggregating information from any application in your ecosystem. As an Application Intelligence Platform (“AIP”), GENIUS AI can pull data from any of your application data sources and provide modern, interactive dashboards and insights within its secure portal. Using machine learning and intelligent insights, GENIUS AI provides Augmented Intelligence to empower you with a deeper and broader view of your systems. You can see everything going on in your various software packages, and make informed, proactive decisions to improve performance and user experience. GENIUS AI is also a core component of our AppCare JD Edwards Managed Services offering.
GENIUS AI is an extensible platform designed to quickly incorporate new application monitors to bring a full-spectrum view of your application footprint. The GSI product developers are continually adding new monitors based on the requests of our clients.
Would you like to be able to focus on growing your business instead of babysitting your business system? Do you want to be able to identify a system anomaly before it becomes a major problem? Are you interested in running on a highly-optimized system all the time instead of some of the time?
If you answered, “yes”, to any of these questions, consider what GENIUS AI can do for you! JDE Administrators face a series of common technical challenges affecting the performance and availability of JD Edwards, yet there are no simple solutions. If you’re involved in CNC, you already know that Server Manager can only take you so far, so what are your other options?
GSI’s GENIUS AI toolset addresses the most challenging system performance issues for JD Edwards EnterpriseOne and other enterprise applications, enabling users to realize optimal performance.

Avoid Downtime
Your business can’t afford the downtime of your business systems, because you need technology that you can trust to manage warranties, track your labor force, and support your customer service efforts. Chances are that your IT team is overwhelmed with debugging, patching, and maintaining your systems even with limited resources.
Our Genius AI system is part of the ongoing value of your business. In addition to this feature, your business can also enjoy the latest enhancements of your systems with JD Edwards EnterpriseOne continuous delivery model.
Increasingly complex system and business needs mean that you need more than just great server management to remain competitive and efficient. Your team can achieve maximum production with a deeper and broader view of your system operations. Our Genius AI gives your company everything you need to focus on your business by helping your managers anticipate problems that can impact performance before they occur.
- Enterprise Servers – Application, Integration, etc.
- Application – System Availability and Health Application
- Web Servers – WebLogic, WebSphere
- Database Management System – Oracle, SQL Server, DB2
- Operating System – Linux, AIX, IBM i, Windows
- Network – Local Area Network and Wide Area Network
NEW FEATURES
DB BLOCKING
.webp)
The main dashboard for our GSI Network Operations Center shows a new alert type called DB Blocking has been detected. We sample the database every 10 minutes, and each sample will detect if blocking is occurring for 10 minutes or more. If so, the alert is generated.
.webp)
Selecting Blocking Details from the alert, we bring up collected information from Server Manager. The top table identifies the Lead Blocker process, followed by the Victim Processes which are being blocked. The SQL and PID’s are capture.
Also, the Kernel information is grabbed which provides further information.
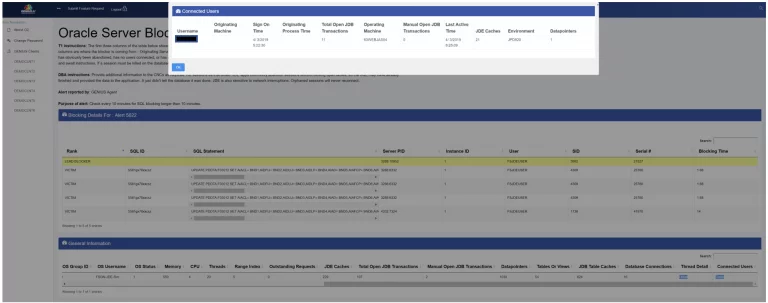
From the Kernel Information table, you can grab Thread Details
Also from the Kernel Information table you can grab the connected user information
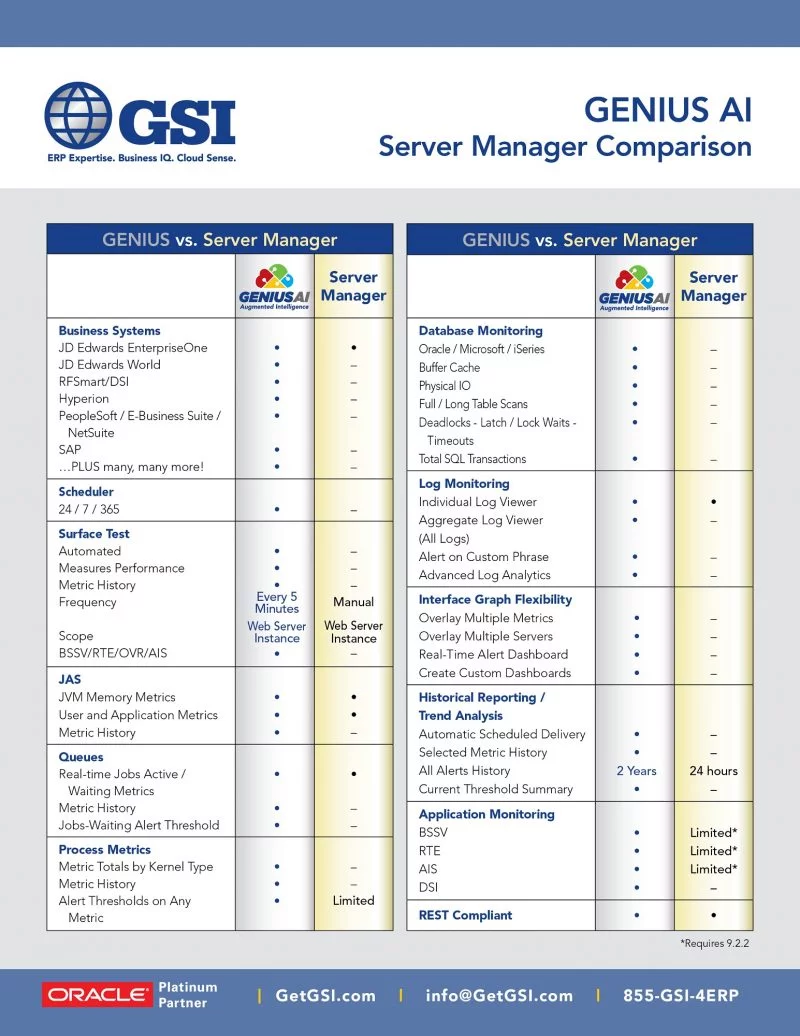
Here’s the critical success factors for monitoring and performance provided by GENIUS AI as well as a comparison for how it stacks up against Server Manager:
Being a 24/7/365 business and having 5 separate instances of JDE running, it’s important to know what’s happening before our end users do. GENIUS AI allows IDEX to:
- Understand if we are running at peak performance at all times
- Do trend analysis of systems, locations, and users
- Monitor several layers of our JDE system: JAS, Enterprise, Database
- Advanced notification of potential issues eliminating risk of downtime
- Engineers engaged fixing issues without the user community knowing
- Comprehensive, straightforward reporting suitable for all levels of your organization
David Hursh
IT Manager – Data Center, Risk, & Compliance/JDE Technical | IDEX Corporation
APP GENIUS
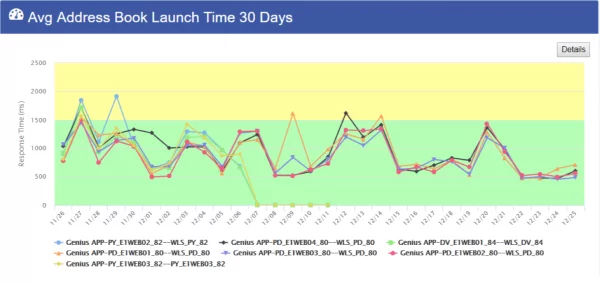
Experience has clearly shown that even the most detailed infrastructure monitoring can show that all the services which make up an application can be functioning properly, but the application can still be down from the user’s perspective, which is what matters most. With this in mind, we’ve created APP GENIUS, to perform the most extensive test of the application possible.
APPLICATION MONITORING
We’ve created several application specific monitors including: RTE, AIS, OVR, Server Manager, and BSSV. Also, we’ve developed 3rd party monitors for DSI and WebLogic.
DB GENIUS
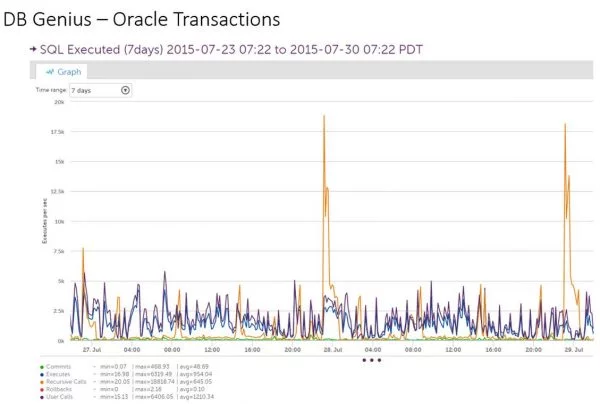
Behind every EnterpriseOne application server is a database on a database server or cluster. Database servers are often shared among multiple applications, so DB GENIUS monitors both the overall health of the database engine, as well as numerous JD Edwards specific metrics about users, jobs, and performance, taken directly from the JD Edwards tables.
E1 GENIUS
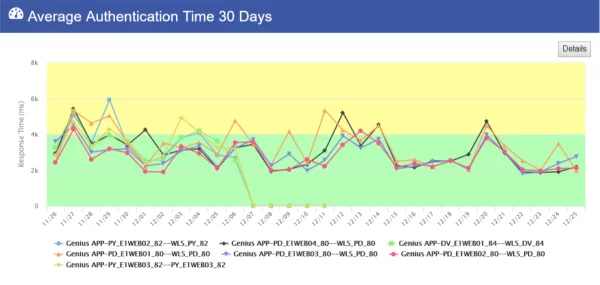
The EnterpriseOne application service is at the heart of JD Edwards, constantly moving data between the JAS and database servers. E1 GENIUS taps directly into the E1 application engine for all the key statistics surrounding processes, kernels, JAS connectivity, database connectivity, and more.
JAS GENIUS
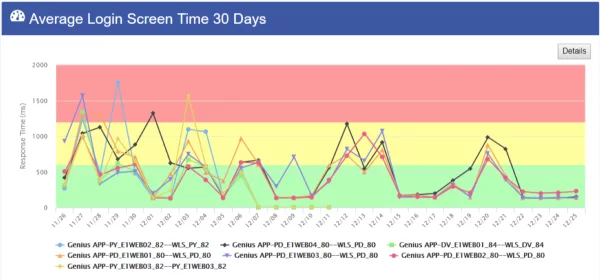
JAS Servers are the face of the JD Edwards application, providing its web-based user interface. JAS GENIUS looks under the hood of the JAS Servers, by monitoring all the critical components of the web services.
UBE GENIUS
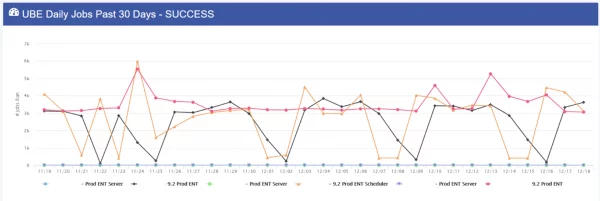
We’ve created UBE GENIUS specifically to provide in-depth insights into the operation of batch jobs. UBE GENIUS dynamically discovers and monitors each queue and batch job, providing a historical view to the patterns of both, as well as notifying the AppCare team of any anomalies in the patterns via real-time alerts. Captured metrics includes but not limited to: Daily Job Totals, Scheduler Health, Next Job Number, Specific Job Detection, Longest Running Jobs.
DB BLOCKING
.webp)
The main dashboard for our GSI Network Operations Center shows a new alert type called DB Blocking has been detected. We sample the database every 10 minutes, and each sample will detect if blocking is occurring for 10 minutes or more. If so, the alert is generated.
.webp)
Selecting Blocking Details from the alert, we bring up collected information from Server Manager. The top table identifies the Lead Blocker process, followed by the Victim Processes which are being blocked. The SQL and PID’s are capture.
Also, the Kernel information is grabbed which provides further information.

From the Kernel Information table, you can grab Thread Details
Also from the Kernel Information table you can grab the connected user information
Benefits
- System Alerting
- Automated Comprehensive Surface Testing
- Internal Escalation Processes
- Reports for Analysis
- Capacity Planning
- Before and After Analysis
- Action Strategy
- New Perspective on User Activity
- Peace of Mind
Operating System Health
- Windows, Linux
- CPU and Memory Utilization
- Disk Utilization/Performance
- Network Utilization and Errors
- Windows Event Log for Errors
Database Health – Oracle, MSSQL, DB2
- Buffer Hit Cache Ratio
- Compilations
- Number of Connections
- DB Page IO
- Index Searches
- Page Life Expectancy
- Full Table Scans
- Latch and Lock Wait Times
- Deadlock and Lock Timeouts
- Requests for locks/latches waited
- Total SQL Transactions
- Page Splits
- Temp Work Files and Tables Created
Application Health – JDE EnterpriseOne, WebLogic, WebSphere
- Automated User Experience Testing
- Instance Level CPU/Memory
- Advanced Batch Job Status
- Advanced User Activity
- WebLogic & WebSphere JVM Health
- JDE Services/Processes
- Queue Stats (Jobs Wait/Active)
- Kernel Stats
- JDE Security Alerting
To find out more about the GENIUS, AppCare Managed Services or any of GSI’s other products or services, call us at 855-GSI-4ERP or click on CONTACT US to send us a request for more information.
Ready To Start?
Our mission is to make every customer a client by offering competitively-priced, full-customizable products and services, providing only the most experienced consultants, and delivering the highest level of service day-after-day, year-after-year.
